Flow Dashboard
The Flow Dashboard is a visual view of everything Flow tracks in your project. This guide covers:
- How to open the dashboard
- The four views, Pulse, Board, Timeline, and Capabilities
- Capturing new work and jumping from a spec to the code it describes
- Why the dashboard never changes your work on its own
Overview
Flow records your work as Markdown files under .flow/. Each change has a brief, a plan, and a test plan, and alongside them Flow keeps a living record of how every capability behaves. That record is complete, but reading it folder by folder is slow, and it never answers the question you have when you sit down to work. What needs me right now?
The dashboard answers that. It reads the same .flow/ directory the skills write and shows you the project at a glance. You see which changes are waiting on you, what shipped recently, how each capability has evolved, and the exact command to move any change forward.
The dashboard is read-only. It never edits a brief, runs a skill, or moves a change forward. Your work advances only when you run a Flow skill, exactly as before. The one thing the dashboard writes is a note of new work you want to start, which the Board section covers.
Opening the dashboard
The dashboard ships with the Flow package, so once you have installed Flow it is already available while you develop. There is nothing extra to install or build.
Installing the package registers a development-only provider in your adonisrc.ts. If the dashboard does not load, confirm the provider is present in the providers array.
{
  providers: [
    // ...your other providers
    {
      file: () => import('@adonisplus/flow/flow_dashboard_provider'),
      environment: ['web'],
    },
  ],
}
The environment: ['web'] scope, together with the provider disabling itself in production, keeps the dashboard out of production builds entirely.
Start your dev server, then open /__dashboard in the browser.
node ace serve --hmr
# Then visit http://localhost:3333/__dashboard
The dashboard is a single self-contained page served straight from the package. Your app runs no frontend build and installs no extra dependencies to use it.
The dashboard reads .flow/ fresh on every load, so it always reflects what the skills have written. It refreshes when you return to the browser tab, and you can refresh it by hand at any time.
Pulse
Pulse is the home view, built to answer two questions at a glance. What needs you, and what just shipped?
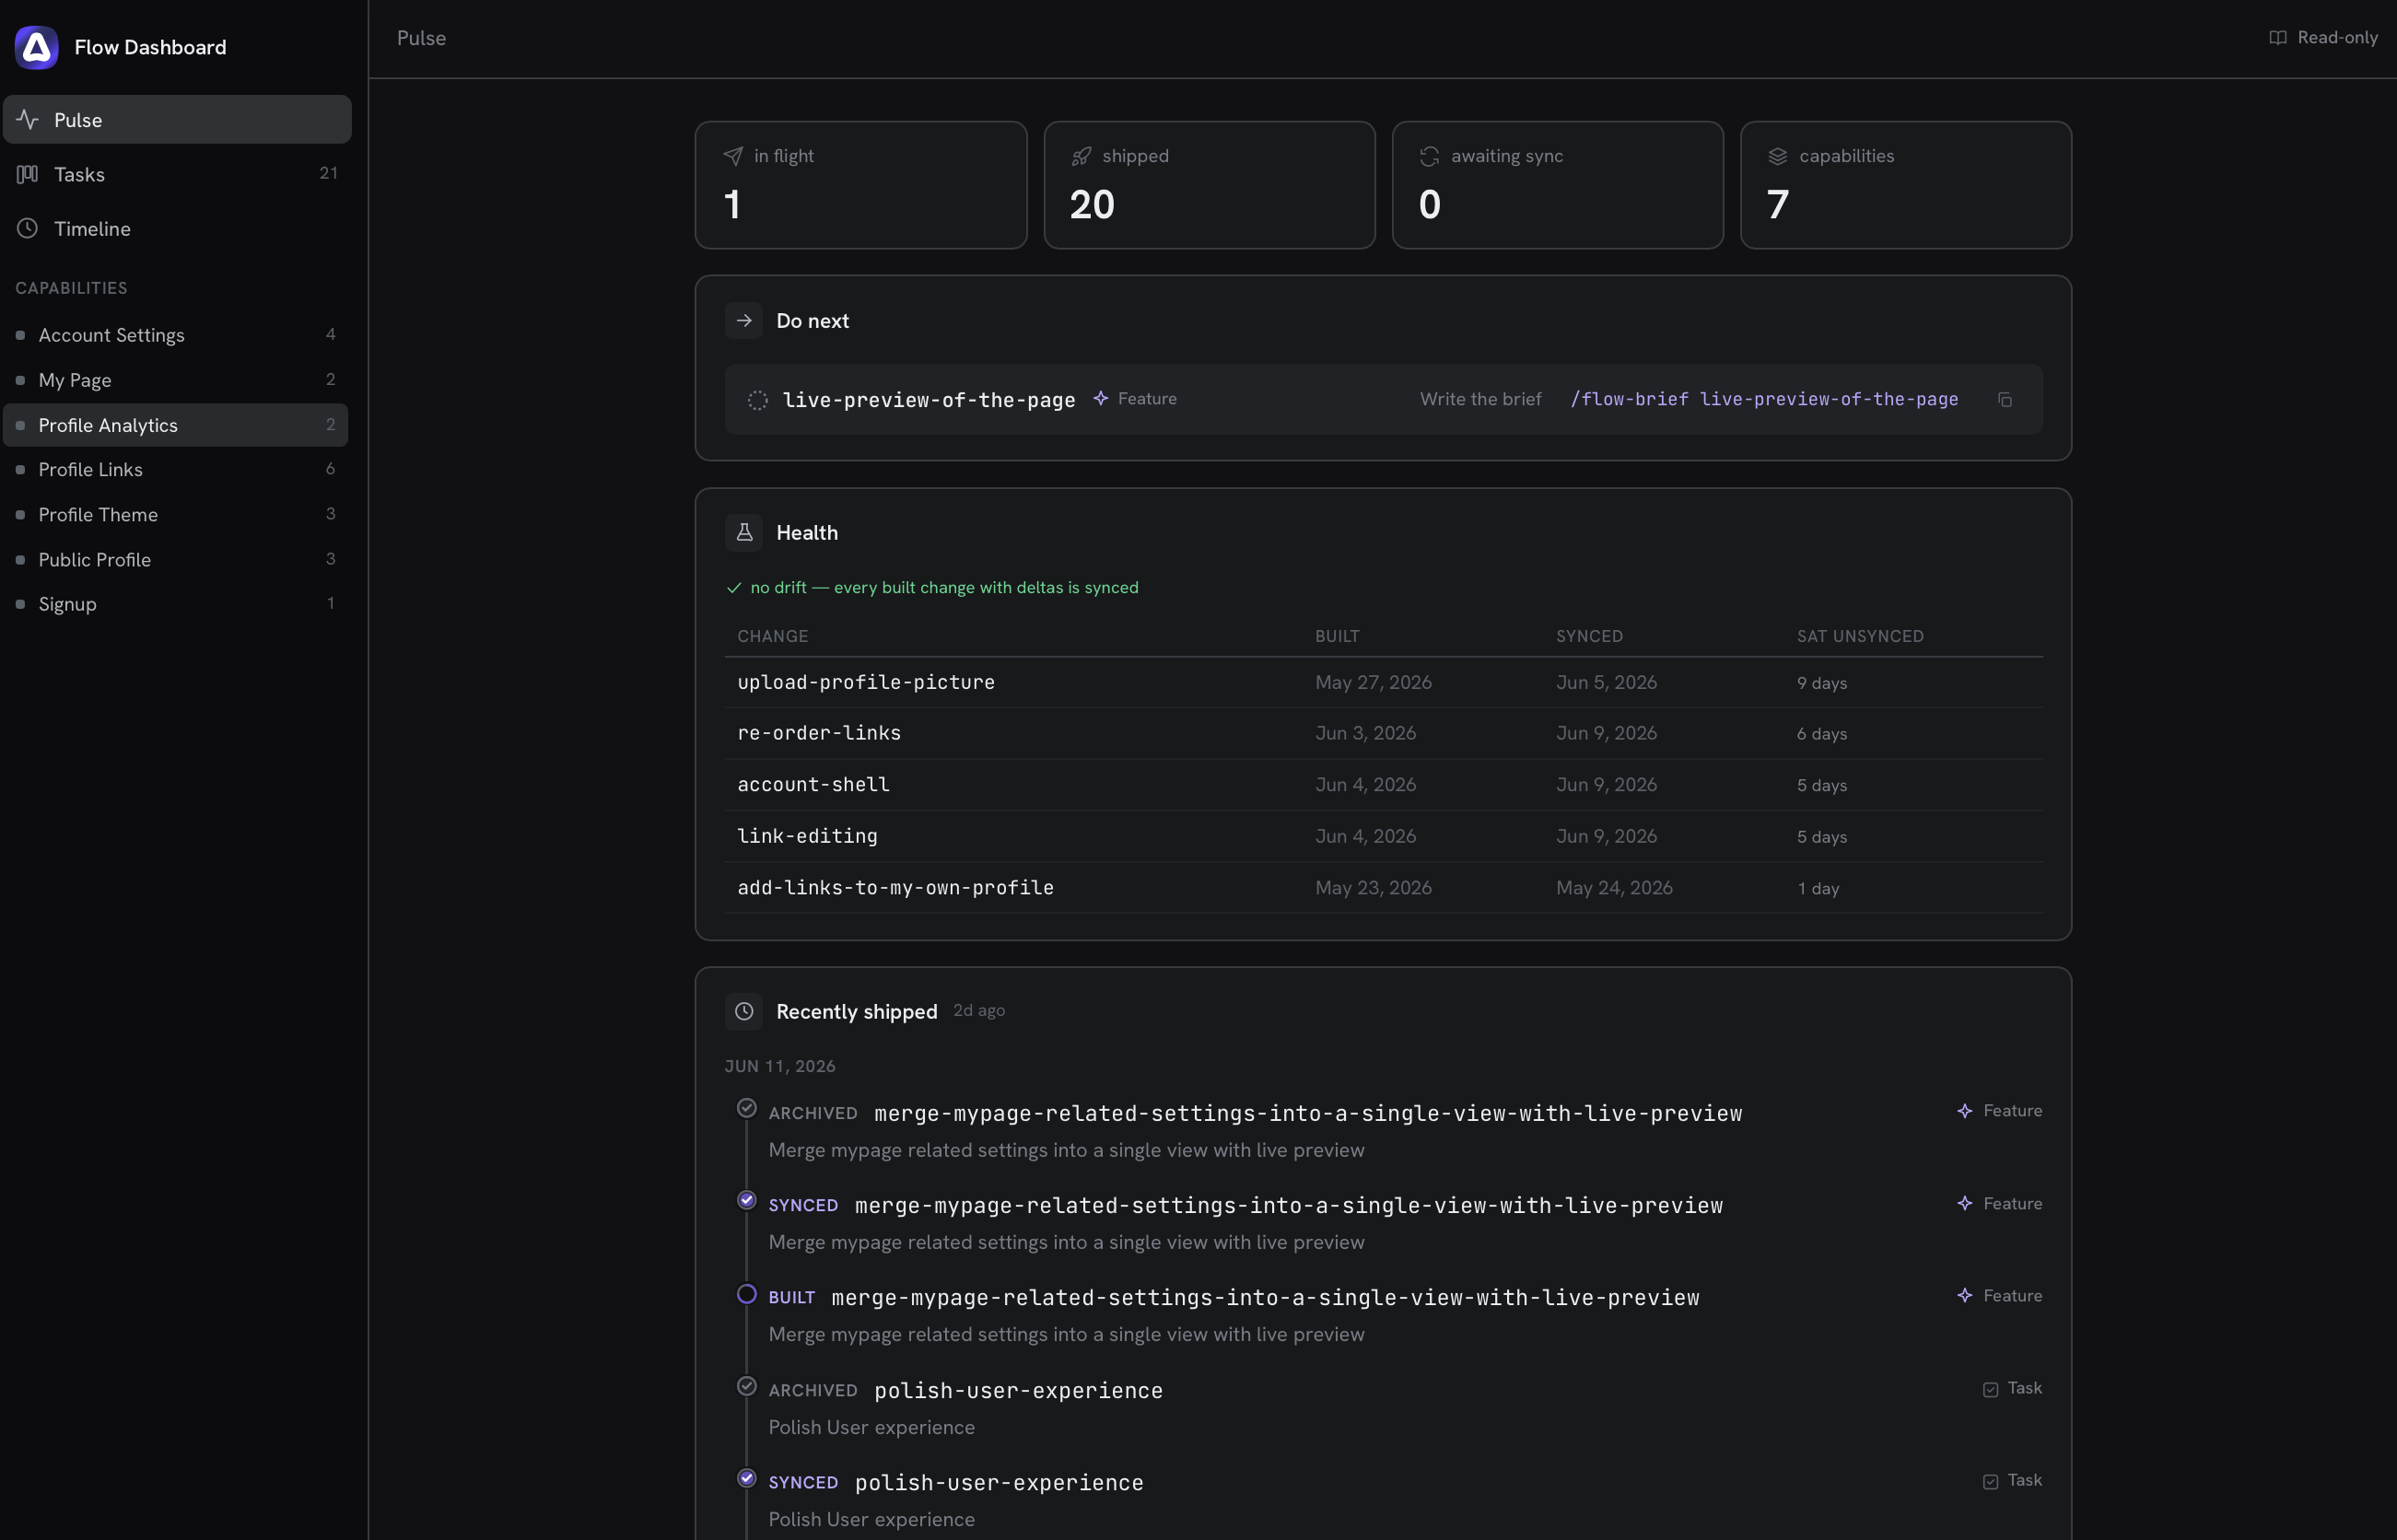
It opens with a row of stats and a Health signal that flags work which is built but not yet synced, along with any change that has sat unfinished for a while. Below that comes Do next, a list of every change that is not yet archived, each paired with the single command that moves it forward, ordered closest-to-done first. A change waiting on /flow-sync sits above one that has not been briefed yet, so the work nearest the finish line is always on top. The view ends with a peek at what shipped most recently.
The command Do next shows you is the same one the skill itself would run, so what you copy is always the correct next step.
Board
The Board lays out your changes in columns by stage, so you can see at a glance what has been briefed, planned, built, and synced. It is where active work lives and where you capture new work.
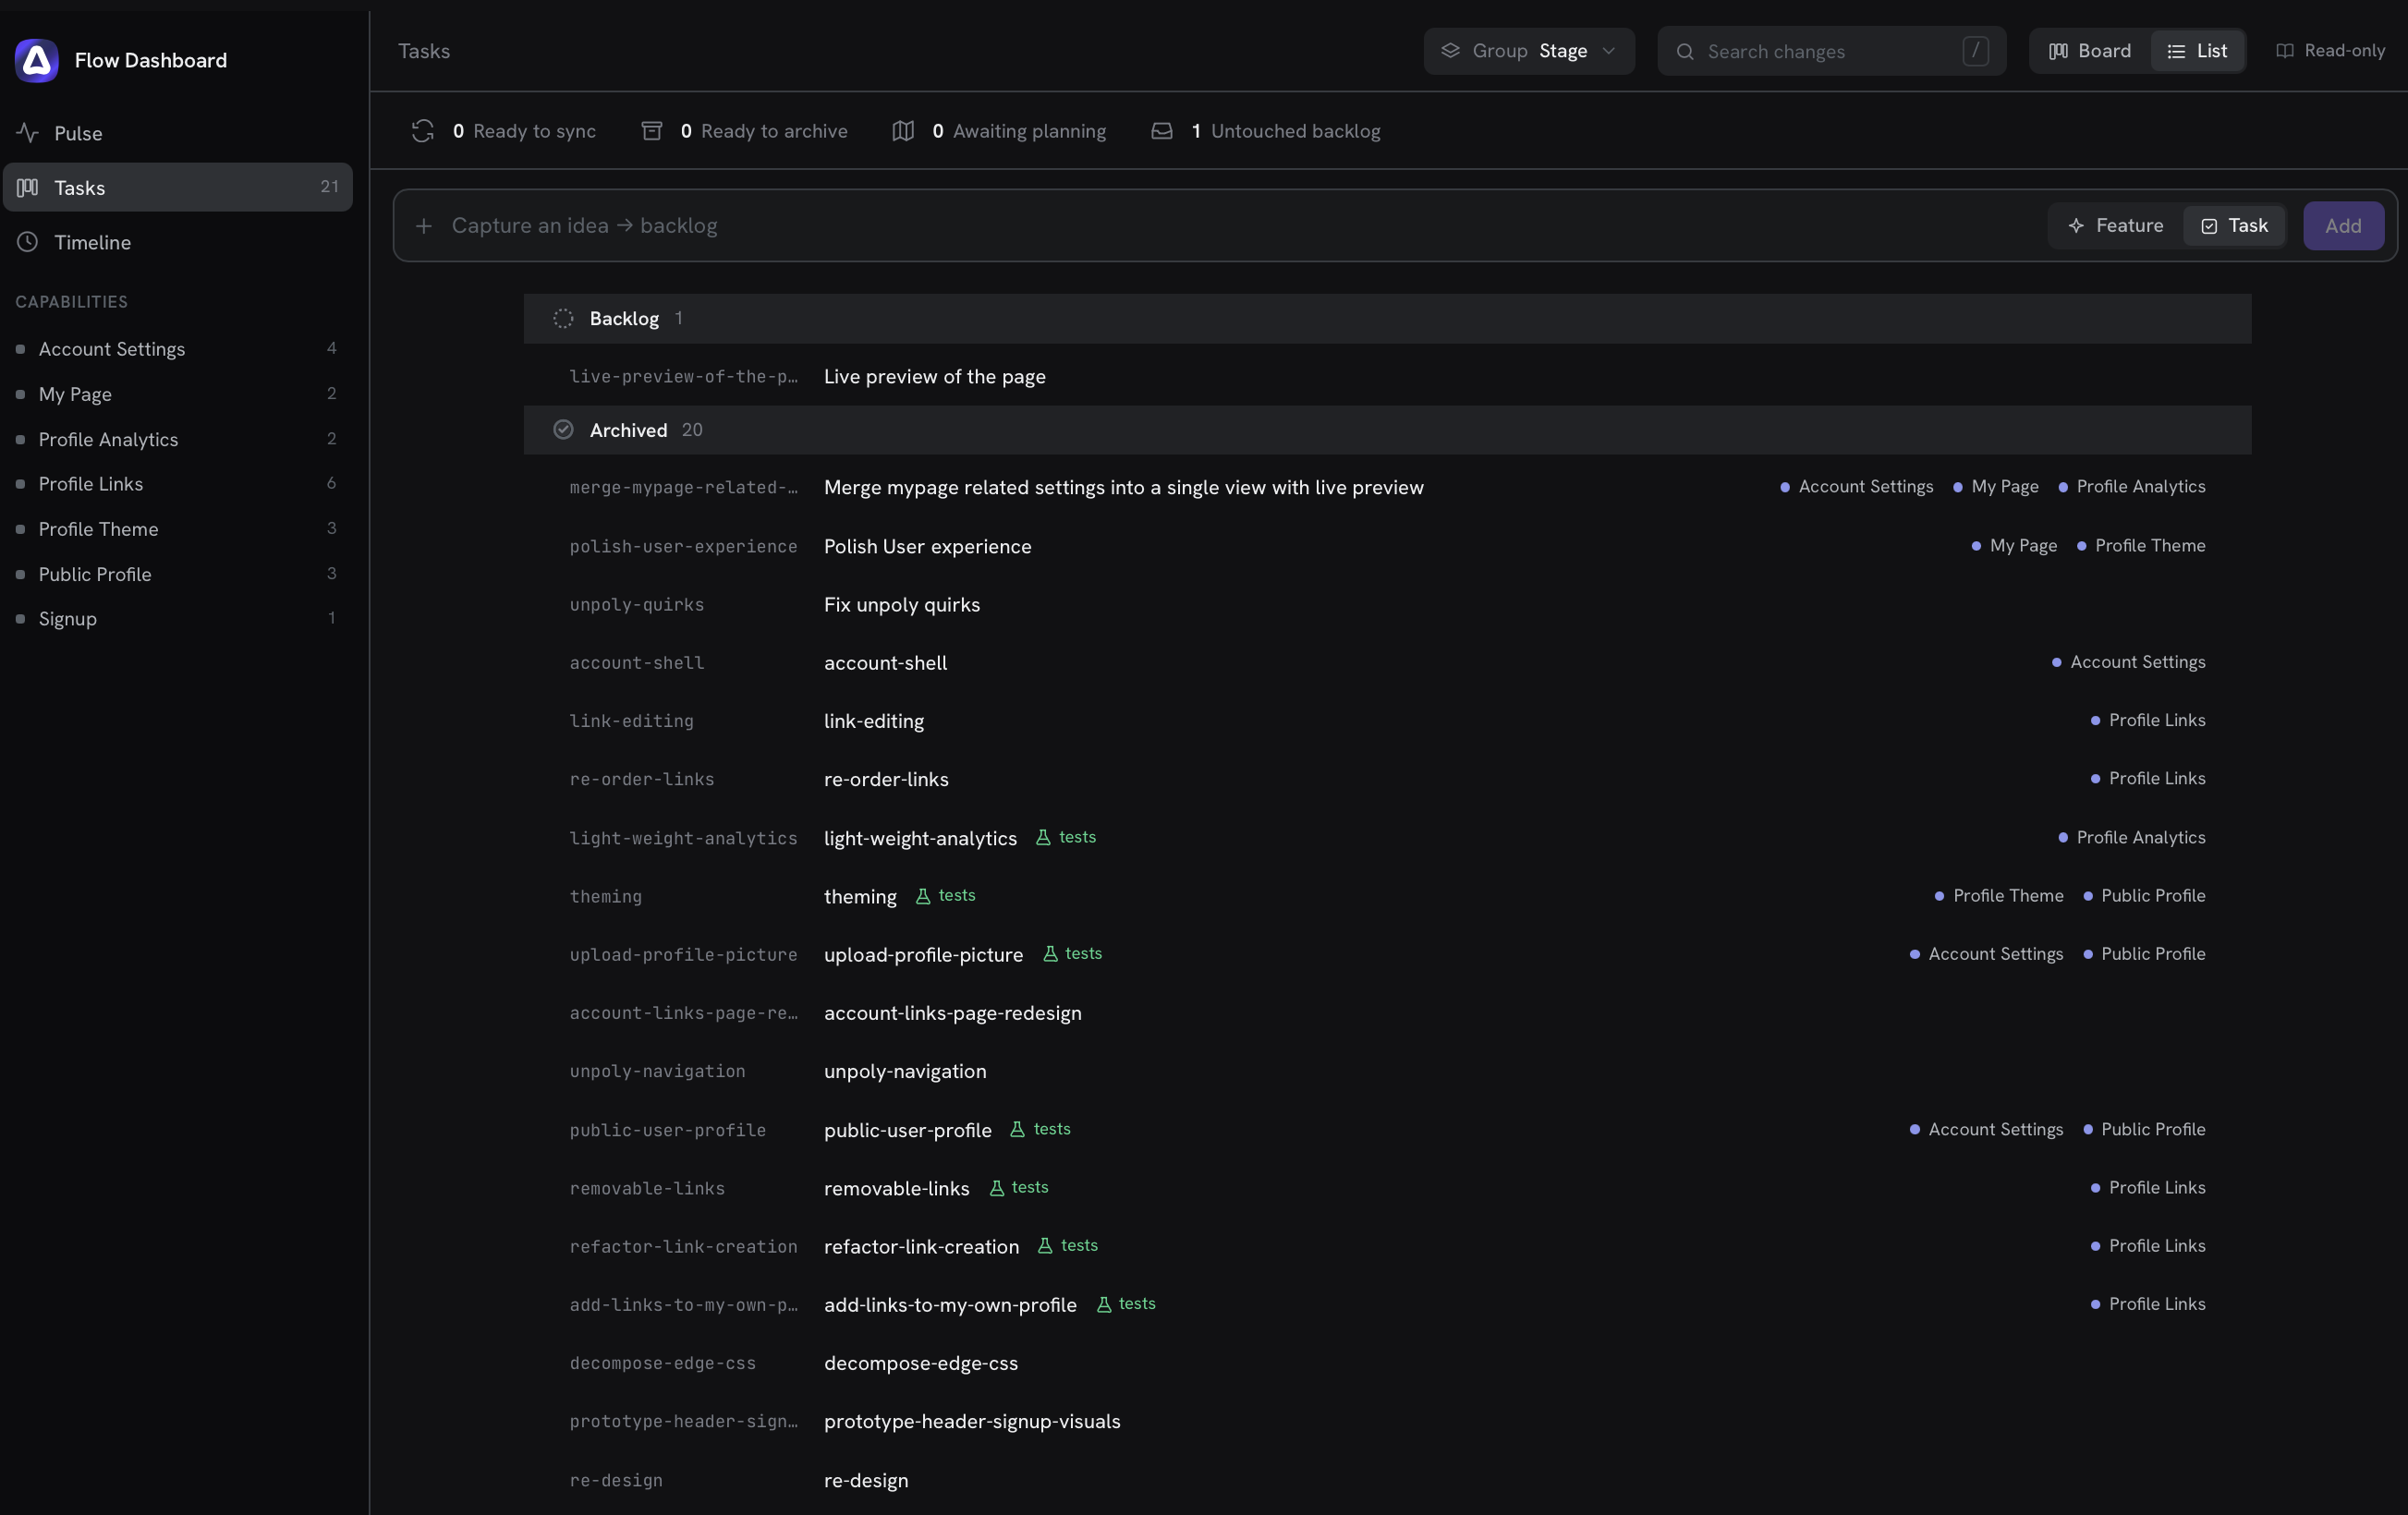
A healthy project archives its finished changes, so its active columns are often nearly empty. The Board expects this. Finished work is tucked behind a labelled count rather than crowding the columns, and an empty column invites you to add work instead of looking broken. A Board / List toggle switches between the stage columns and a flat, scannable index of every change.
At the top sits the add-task field, the dashboard's one way to write. Type what you want to do, choose whether it is a feature or an open-ended task, and the dashboard turns your words into a change name and records it as a backlog item in .flow/boards/main.yml. It then hands you the command to begin, /flow-brief <name> for a feature or /flow-task <name> for a task.
Adding a task only captures the intent. The dashboard does not interview you or write a plan; you do that by running the command it gives you. See Brief and Open-ended tasks for what happens next.
Timeline
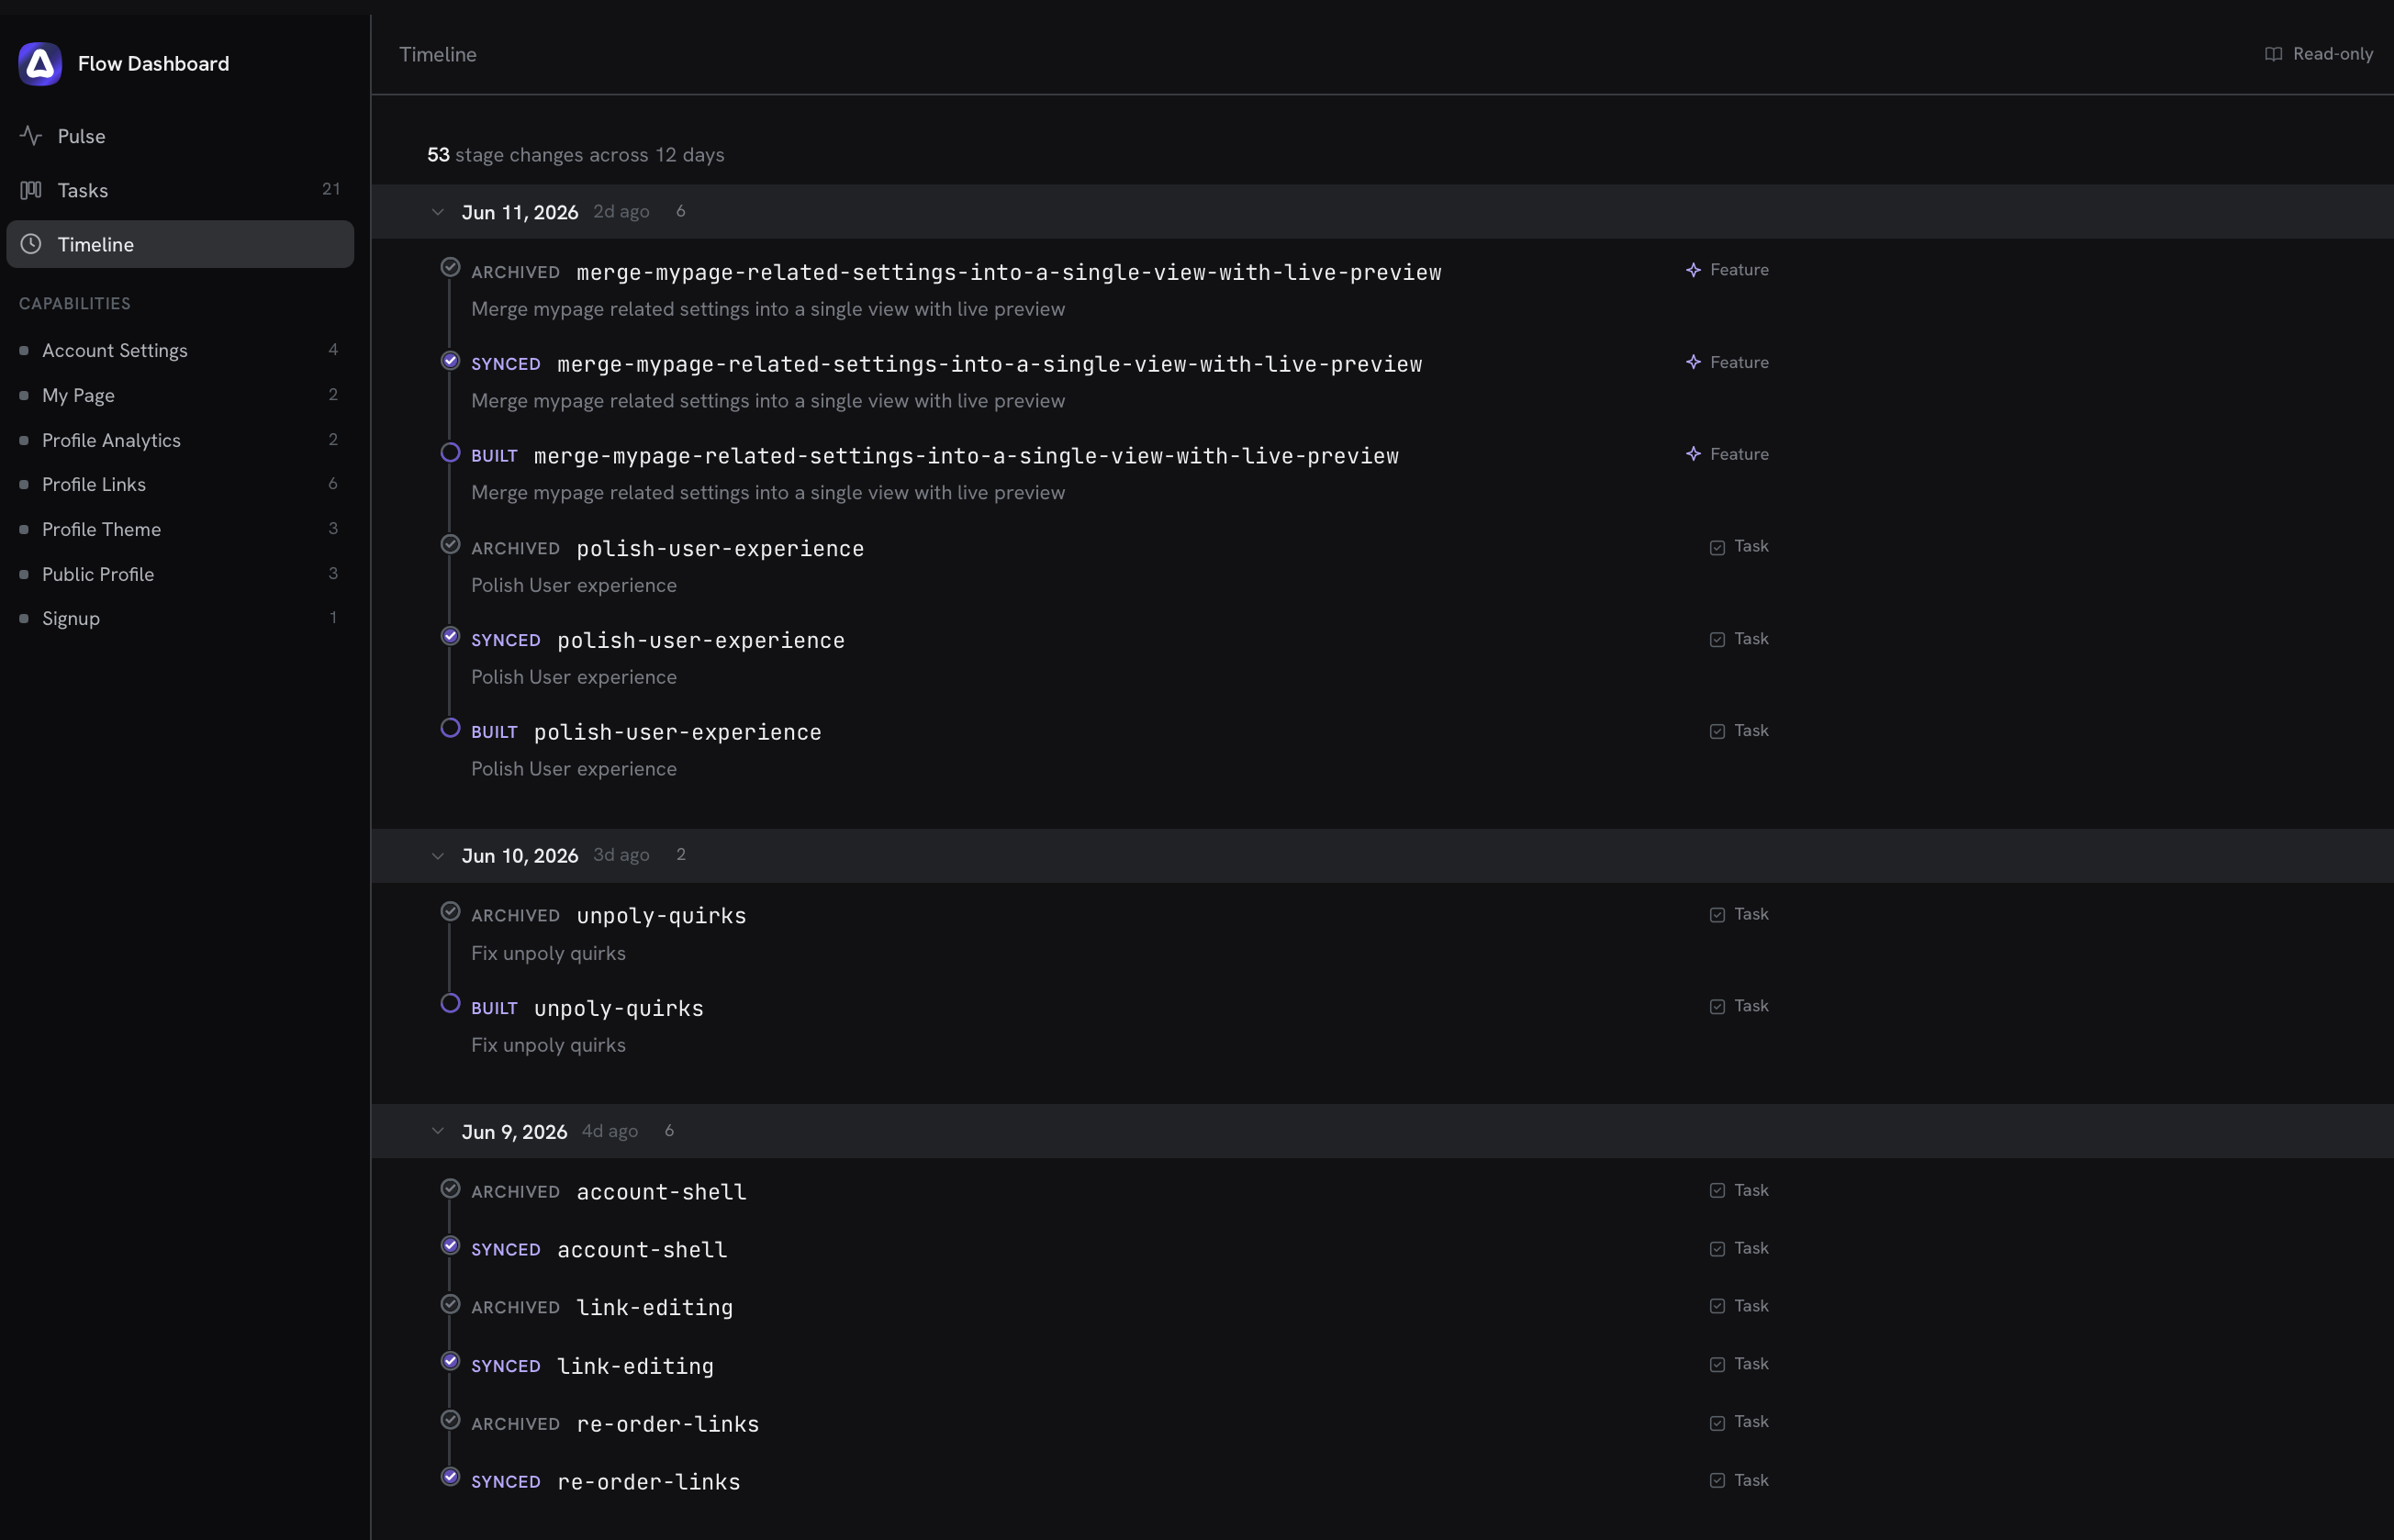
The Timeline is a reverse-chronological feed of everything that has happened across your changes, showing when each was briefed, planned, built, and synced. It gives you the project's recent history at a glance, newest first.
Capabilities
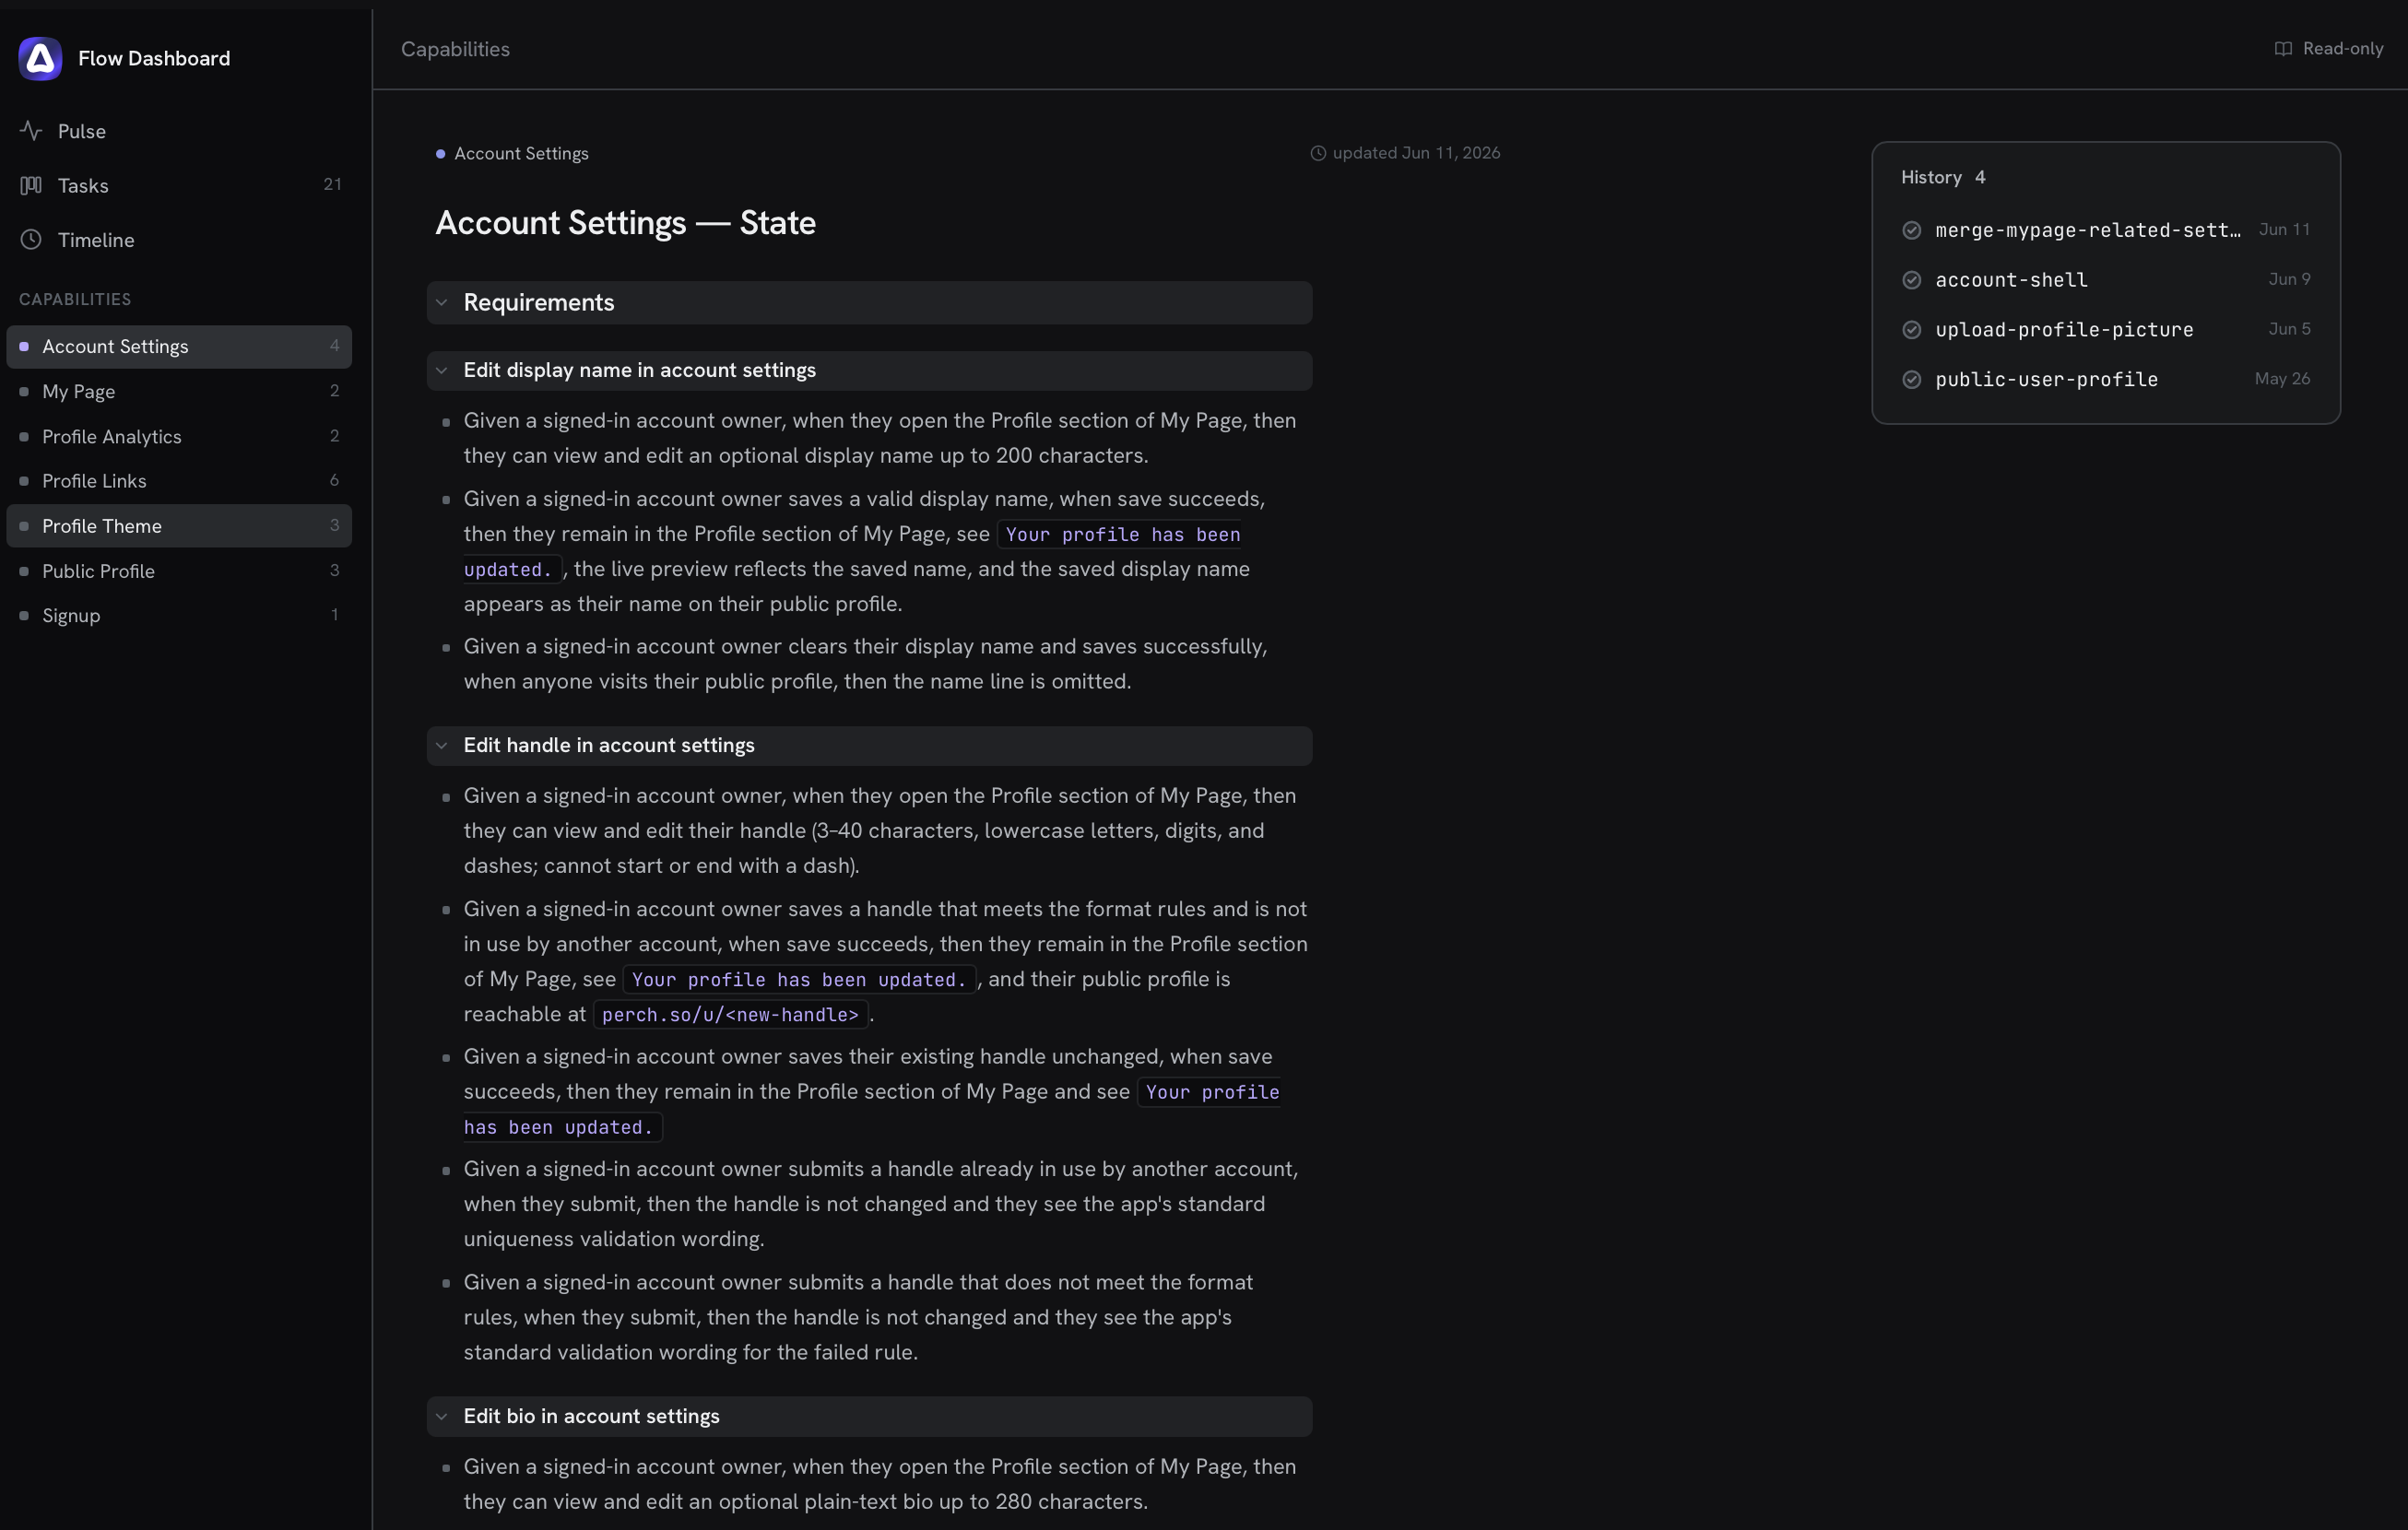
A capability is a named area of behavior in your app, such as "projects" or "billing". Flow keeps a living description of what each one does today. The Capabilities view gives every capability its own page.
A capability page shows two things side by side. On one side is what the capability does today, and on the other is the history of every change that has shaped it, newest first. The history stays in view as you read, so you can see both the current behavior and how it got there without leaving the page.
Advancing a change
Open any change to see its detail. The brief, plan, test plan, and deltas are rendered as readable Markdown, beside a rail that shows where the change is and what comes next.
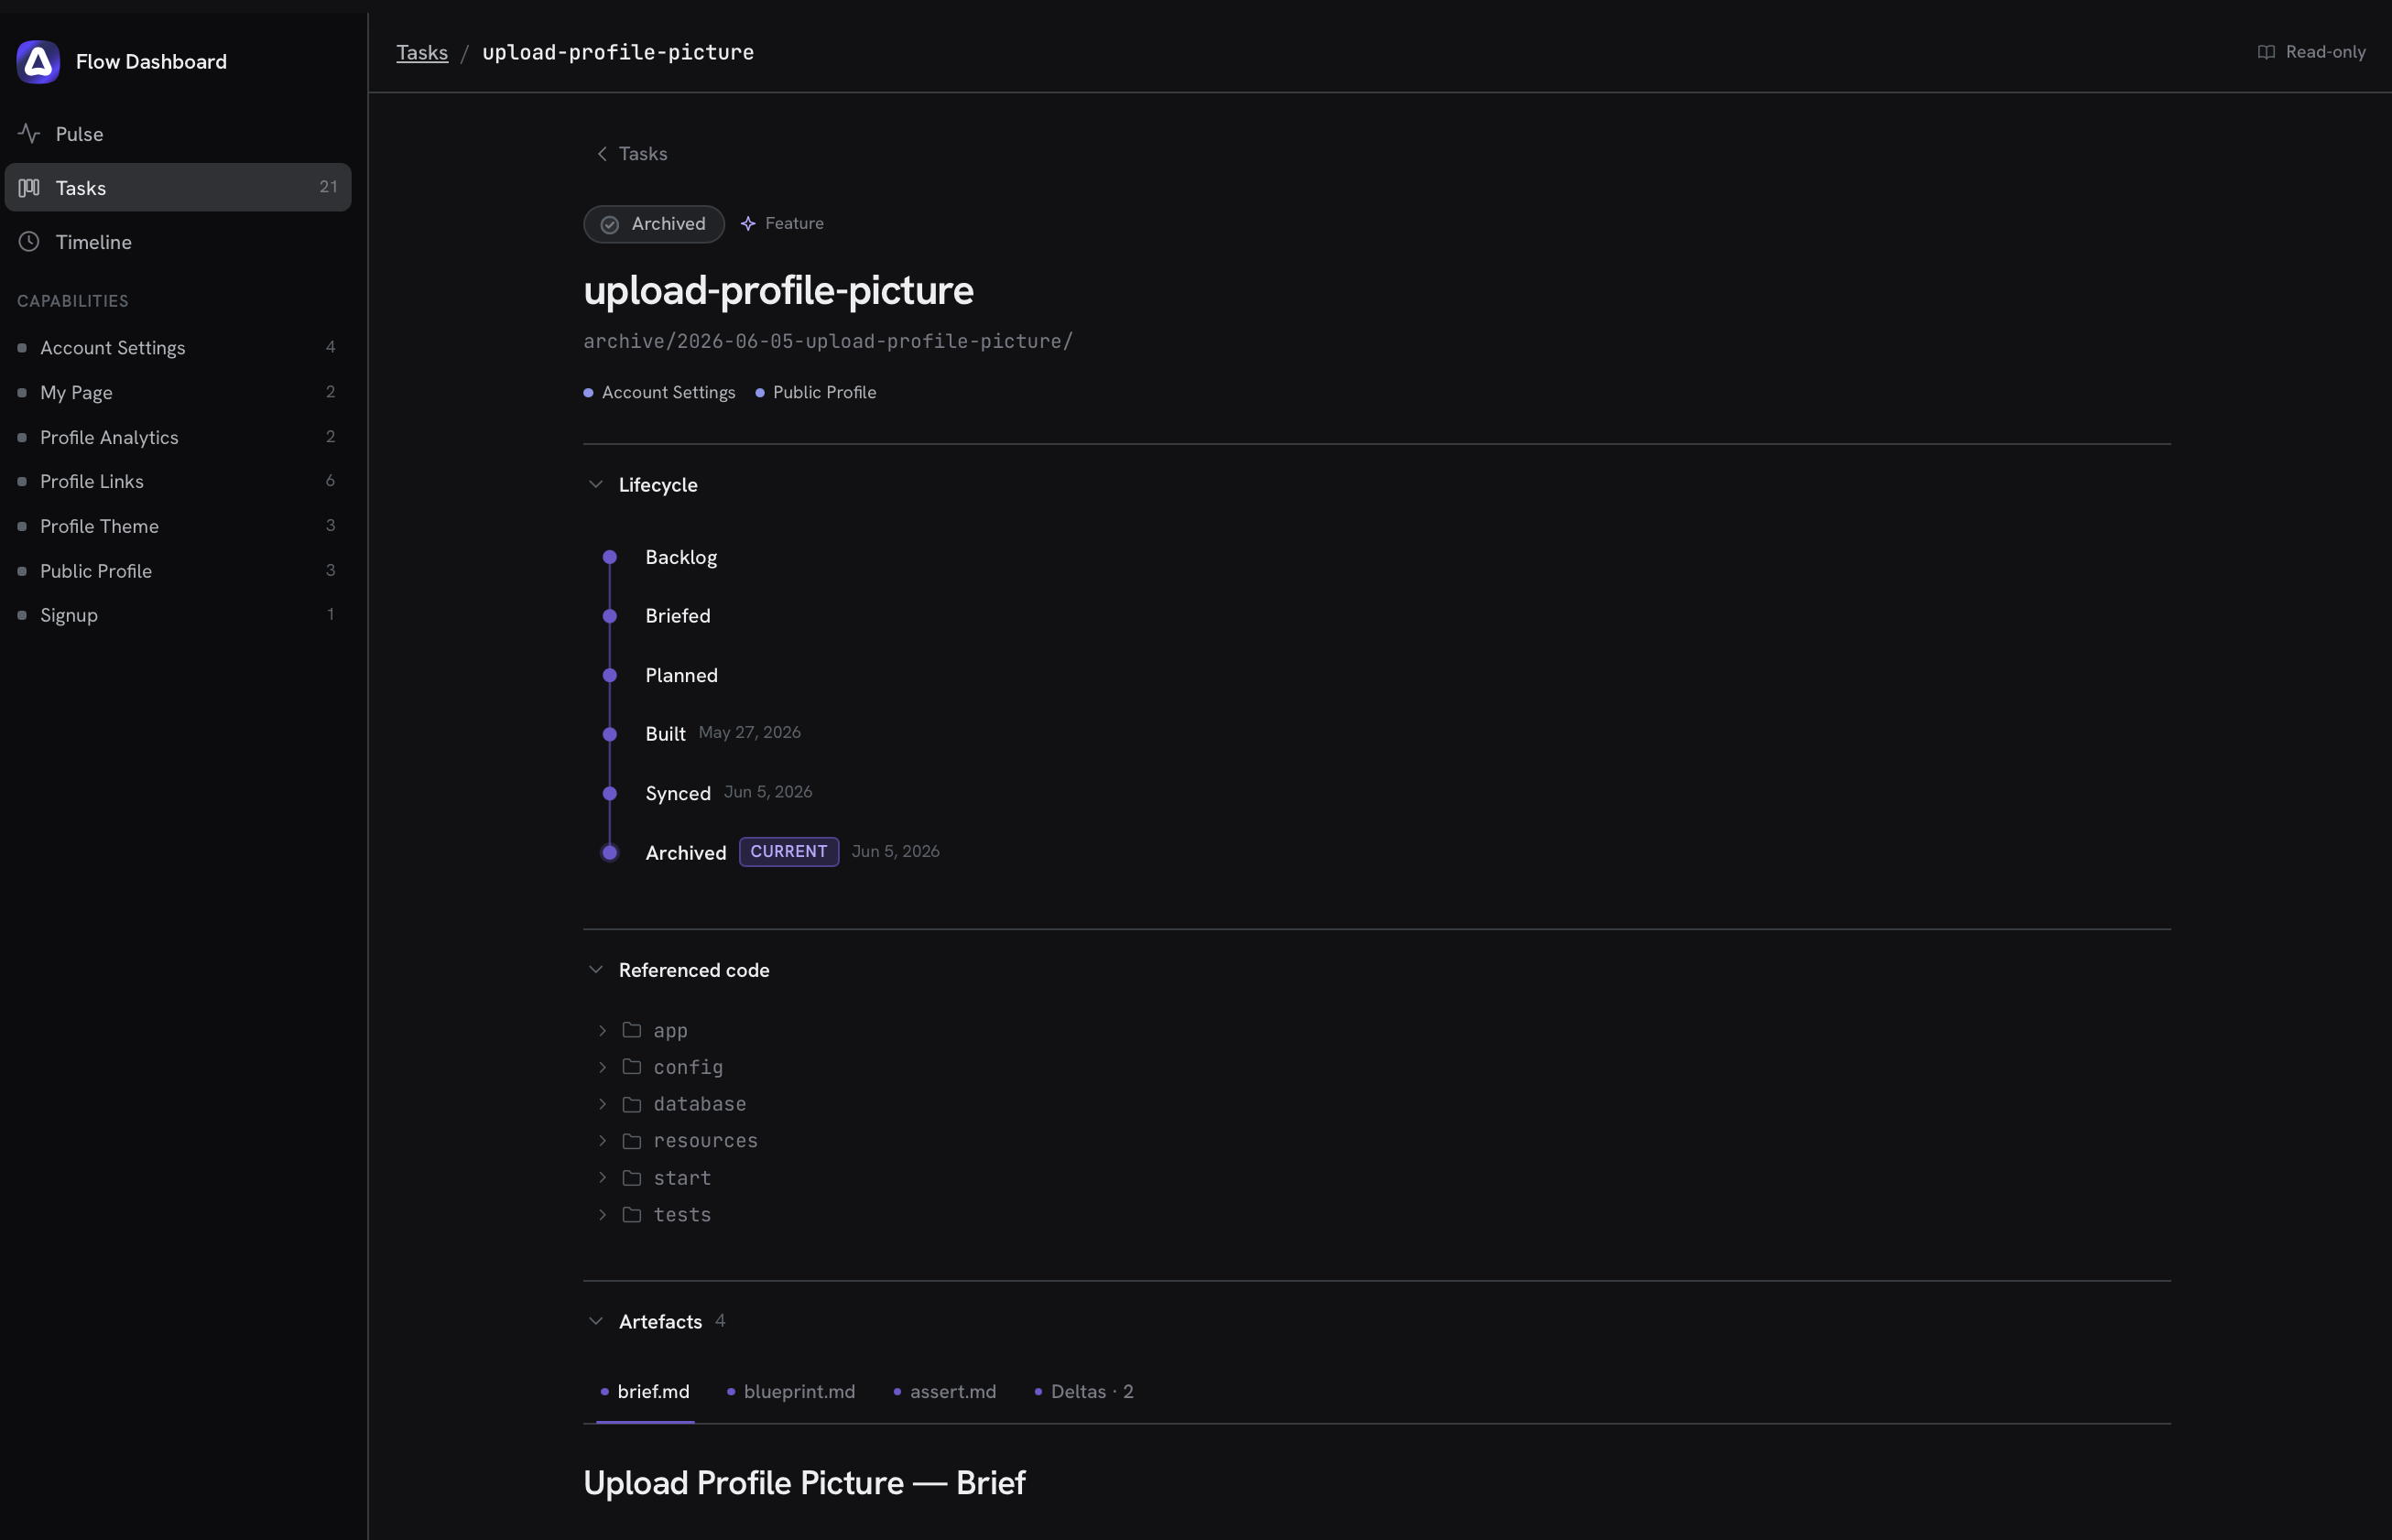
The rail puts the next action right where the change is headed. For most stages this is a ready-to-copy Flow command with the change name already filled in, such as /flow-blueprint search-ranking for a briefed change, or /flow-sync search-ranking for one that has been built. You copy it and run it in your agent, and the dashboard never runs it for you.
A planned feature is the one point where the path forks. You can spec its behavior first with /flow-assert, or build straight away with /flow-build. A planned task instead shows an instruction to implement its workflow.md, because a task is built by working through its workflow rather than by a separate command.
Jumping to the code
The specs you write name real files. A blueprint that adds app/services/profile_analytics_service.ts is naming a file that exists on disk once the change is built.
The dashboard turns those names into links. It reads the file paths out of your briefs, blueprints, test plans, and deltas, and checks each one against your project, linking only the paths that actually resolve. A path a spec names but that does not exist is left unlinked, a quiet sign that the spec and the code have drifted apart.
Clicking a link opens the file in your editor through its registered URL scheme (vscode://, phpstorm://, zed://, and others), so the file opens on the machine you are viewing the dashboard from.
The dashboard reads your preferred editor from the $FLOW_EDITOR, $VISUAL, and $EDITOR environment variables, in that order. Set $FLOW_EDITOR to be explicit.
export FLOW_EDITOR=phpstormVS Code, PhpStorm, WebStorm, Sublime Text, Atom, Zed, MacVim, Emacs, and TextMate are supported. An unrecognized editor falls back to the vscode:// scheme.
If your editor has no registered URL scheme, clicking a file link does nothing rather than reporting an error. The operating system, not the dashboard, decides what a vscode://-style link does.
What the dashboard does not do
The dashboard is a window onto your work, not a second way to do it. It does not run skills, edit your briefs and plans, or move a change forward. The only thing it writes is a backlog item when you capture new work with add-task. Everything else changes only when you run a Flow skill on disk.
Next steps
- Start a feature you captured with the Brief skill.
- Start open-ended work with the Open-ended tasks skill.